Map Projection Overview
Peter H. Dana
These materials were developed by Peter H. Dana, Department of
Geography, University of Texas at Austin, 1995. These materials
may be
used for study, research, and education in not-for-profit
applications.
If you link to or cite these materials, please credit the
author, Peter
H. Dana, The Geographer's Craft Project, Department of
Geography, The University
of Colorado at Boulder. These materials may not be copied to or
issued
from another Web server without the author's express permission.
Copyright
1999 Peter H. Dana. All commercial rights are reserved. If you
have
comments or suggestions, please contact the author or Kenneth E.
Foote
at ken.foote@uconn.edu.
This page is available in a framed
version. For convenience, a Full
Table
of Contents is provided.
Associated Overviews
Introduction
-
Map projections are attempts to portray the surface of the earth
or a portion
of the earth on a flat surface. Some distortions of
conformality, distance,
direction, scale, and area always result from this process. Some
projections
minimize distortions in some of these properties at the expense
of maximizing
errors in others. Some projection are attempts to only
moderately distort
all of these properties.
-
Conformality
-
When the scale of a map at any point on the map is the same
in any direction,
the projection is conformal. Meridians (lines of longitude)
and parallels
(lines of latitude) intersect at right angles. Shape is
preserved locally
on conformal maps.
-
Distance
-
A map is equidistant when it portrays distances from the
center of the
projection to any other place on the map.
-
Direction
-
A map preserves direction when azimuths (angles from a point
on a line
to another point) are portrayed correctly in all directions.
-
Scale
-
Scale is the relationship between a distance portrayed on a
map and the
same distance on the Earth.
-
Area
-
When a map portrays areas over the entire map so that all
mapped areas
have the same proportional relationship to the areas on the
Earth that
they represent, the map is an equal-area map.
-
Different map projections result in different spatial
relationships between
regions.
-
Map projections fall into four general classes.
-
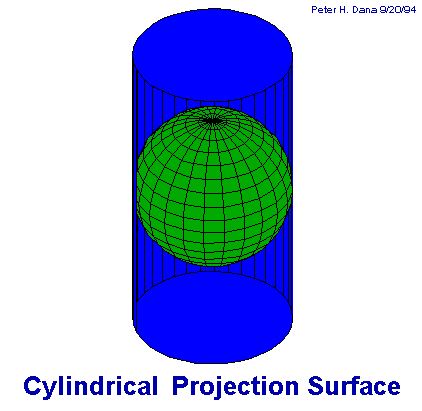
Cylindrical projections result from projecting a spherical
surface onto
a cylinder.
-
When the cylinder is tangent to the sphere contact is along
a great circle
(the circle formed on the surface of the Earth by a plane
passing through
the center of the Earth)..
-
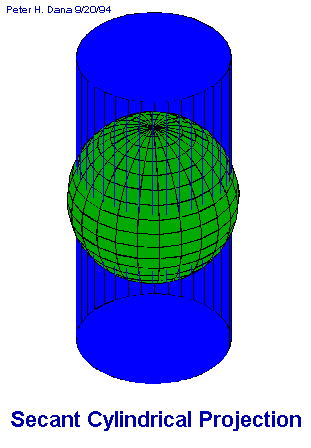
In the secant case, the cylinder touches the sphere along
two lines, both
small circles (a circle formed on the surface of the Earth
by a plane not
passing through the center of the Earth).
-
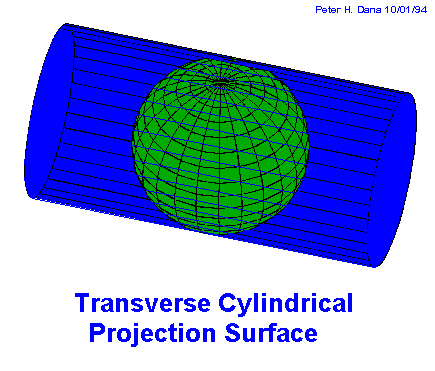
When the cylinder upon which the sphere is projected is at
right angles
to the poles, the cylinder and resulting projection are
transverse.
-
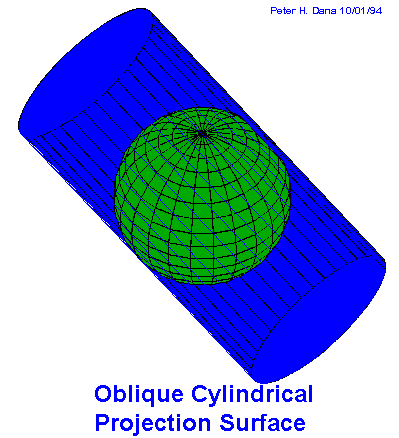
When the cylinder is at some other, non-orthogonal, angle
with respect
to the poles, the cylinder and resulting projection is
oblique.
-
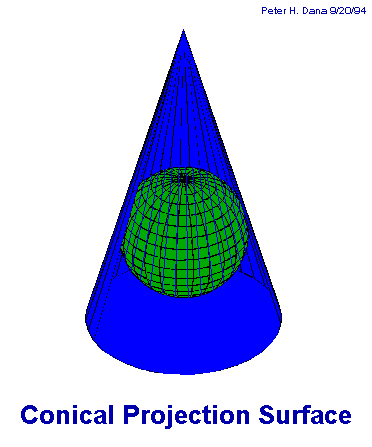
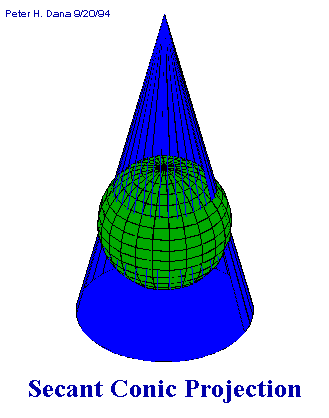
Conic projections result from projecting a spherical surface
onto a cone.
-
When the cone is tangent to the sphere contact is along a
small circle.
-
In the secant case, the cone touches the sphere along two
lines, one a
great circle, the other a small circle.
-
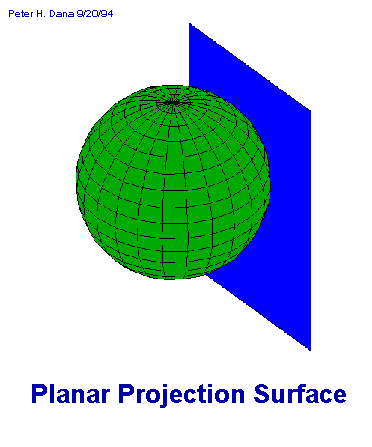
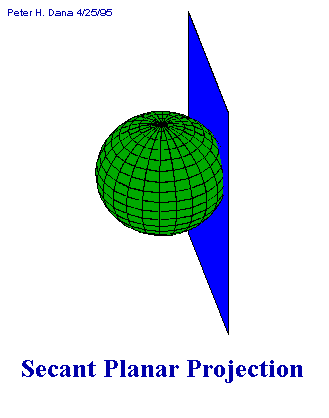
Azimuthal projections result from projecting a spherical
surface onto a
plane.
-
When the plane is tangent to the sphere contact is at a
single point on
the surface of the Earth.
-
In the secant case, the plane touches the sphere along a
small circle if
the plane does not pass through the center of the earth,
when it will touch
along a great circle.
-
Miscellaneous projections include unprojected ones such as
rectangular
latitude and longitude grids and other examples of that do not
fall into
the cylindrical, conic, or azimuthal categories
 Table
of Contents
Table
of Contents
Selected Map Projections
Cylindrical Projections
-
Cylindrical Equal Area
-
Cylindrical Equal-Area projections have straight meridians and
parallels,
the meridians are equally spaced, the parallels unequally
spaced. There
are normal, transverse, and oblique cylindrical equal-area
projections.
Scale is true along the central line (the equator for normal,
the central
meridian for transverse, and a selected line for oblique) and
along two
lines equidistant from the central line. Shape and scale
distortions increase
near points 90 degrees from the central line.
-
Behrmann Cylindrical Equal-Area
-
Gall's Stereographic Cylindrical
-
Gall's stereographic cylindrical projection results from
projecting the
earth's surface from the equator onto a secant cylinder
intersected by
the globe at 45 degrees north and 45 degrees south. This
projection moderately
distorts distance, shape, direction, and area.
-
 Gall's
Sterographic Cylindrical
Gall's
Sterographic Cylindrical
-
Peters
-
The Peters projection is a cylindrical equal-area projection
that de-emphasizes
area exaggerations in high latitudes by shifting the
standard parallels
to 45 or 47 degrees.
-
Peters
-
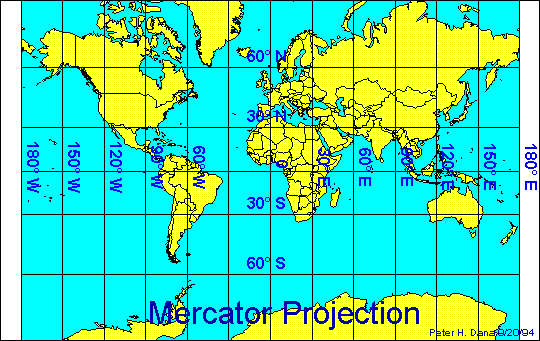
Mercator
-
The Mercator projection has straight meridians and parallels
that intersect
at right angles. Scale is true at the equator or at two
standard parallels
equidistant from the equator. The projection is often used for
marine navigation
because all straight lines on the map are lines of constant
azimuth.
-
Mercator
-
Miller Cylindrical
-
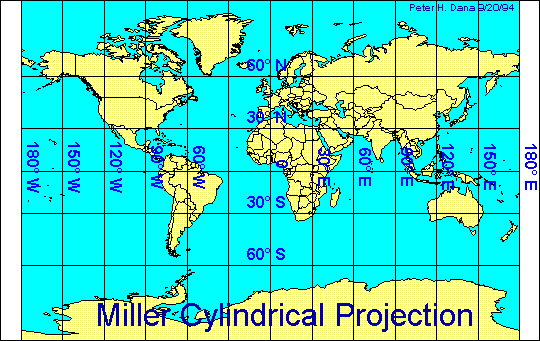
The Miller projection has straight meridians and parallels
that meet at
right angles, but straight lines are not of constant azimuth.
Shapes and
areas are distorted. Directions are true only along the
equator. The projection
avoids the scale exaggerations of the Mercator map.
-
Miller
Cylindrical
-
Oblique Mercator
-
Oblique Mercator projections are used to portray regions along
great circles.
Distances are true along a great circle defined by the tangent
line formed
by the sphere and the oblique cylinder, elsewhere distance,
shape, and
areas are distorted. Once used to map Landsat images (now
replaced by the
Space Oblique Mercator), this projection is used for areas
that are long,
thin zones at a diagonal with respect to north, such as Alaska
State Plane
Zone 5001.
-
Oblique
Mercator (Alaska State Plane Zone 5001)
-
Transverse Mercator
-
Transverse Mercator projections result from projecting the
sphere onto
a cylinder tangent to a central meridian. Transverse Mercator
maps are
often used to portray areas with larger north-south than
east-west extent.
Distortion of scale, distance, direction and area increase
away from the
central meridian.
-
Many national grid systems are based on the Transverse
Mercator projection
-
The British National Grid (BNG) is based on the National
Grid System of
England, administered by the British Ordnance Survey. The
true origin of
the system is at 49 degrees north latitude and 2 degrees
west longitude.
The false origin is 400 km west and 100 km north. Scale at
the central
meridian is 0.9996. The first BNG designator defines a 500
km square. The
second designator defines a 100 km square. The remaining
numeric characters
define 10 km, 1 km, 100 m, 10 m, or 1 m eastings and
northings.
-
British
National
Grid 100 km Squares
-
The Universal Transverse Mercator (UTM) projection is used to
define horizontal,
positions world-wide by dividing the surface of the Earth into
6 degree
zones, each mapped by the Transverse Mercator projection with
a central
meridian in the center of the zone. UTM zone numbers designate
6 degree
longitudinal strips extending from 80 degrees South latitude
to 84 degrees
North latitude. UTM zone characters designate 8 degree zones
extending
north and south from the equator.
-
UTM
Zones
-
Eastings are measured from the central meridian (with a
500km false easting
to insure positive coordinates). Northings are measured from
the equator
(with a 10,000km false northing for positions south of the
equator).
-
UTM
Zone 14
Table
of Contents
Pseudocylindrical Projections
-
Pseudocylindrical projections resemble cylindrical projections,
with straight
and parallel latitude lines and equally spaced meridians, but
the other
meridians are curves.
-
Mollweide
-
The Mollweide projection, used for world maps, is
pseudocylindrical and
equal-area. The central meridian is straight. The 90th
meridians are circular
arcs. Parallels are straight, but unequally spaced. Scale is
true only
along the standard parallels of 40:44 N and 40:44 S.
-
Mollweide
Projection
-
Eckert Projections
-
Eckert IV Equal Area
-
The Eckert IV projection, used for world maps, is a
pseudocylindrical and
equal-area. The central meridian is straight, the 180th
meridians are semi-circles,
other meridians are elliptical. Scale is true along the
parallel at 40:30
North and South.
-
Eckert
IV
Equal Area
-
Eckert VI Equal Area
-
The Eckert VI projection , used for maps of the world, is
pseudocylindrical
and equal area. The central meridian and all parallels are
at right angles,
all other meridians are sinusoidal curves. Shape distortion
increases at
the poles. Scale is correct at standard parallels of 49:16
North and South.
-
Eckert
VI
Equal Area
-
Robinson
-
The Robinson projection is based on tables of coordinates, not
mathematical
formulas. The projection distorts shape, area, scale, and
distance in an
attempt to balance the errors of projection properties.
-
Robinson
-
Sinusoidal Equal Area
-
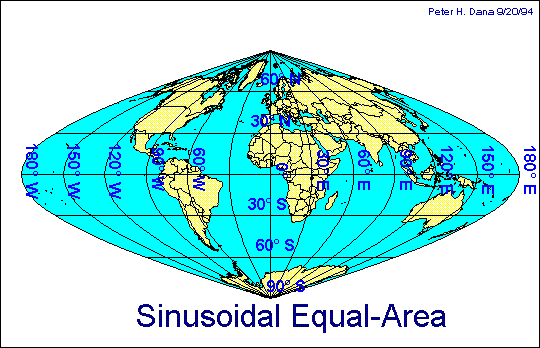
Sinusoidal equal-area maps have straight parallels at right
angles to a
central meridian. Other meridians are sinusoidal curves. Scale
is true
only on the central meridian and the parallels. Often used in
countries
with a larger north-south than east-west extent.
-
Sinusoidal
Equal Area
Table
of Contents
Conic Projections
-
Albers Equal Area Conic
-
A conic projection that distorts scale and distance except
along standard
parallels. Areas are proportional and directions are true in
limited areas.
Used in the United States and other large countries with a
larger east-west
than north-south extent.
-
Albers
Equal-Area Conic
-
Equidistant Conic
-
Direction, area, and shape are distorted away from standard
parallels.
Used for portrayals of areas near to, but on one side of, the
equator.
-
Equidistant
Conic
-
Lambert Conformal Conic
-
Polyconic
-
The polyconic projection was used for most of the earlier USGS
topographic
quadrangles. The projection is based on an infinite number of
cones tangent
to an infinite number of parallels. The central meridian is
straight. Other
meridians are complex curves. The parallels are non-concentric
circles.
Scale is true along each parallel and along the central
meridian.
-
Polyconic
(North America)
Table
of Contents
Azimuthal Projections
-
Azimuthal Equidistant
-
Azimuthal equidistant projections are sometimes used to show
air-route
distances. Distances measured from the center are true.
Distortion of other
properties increases away from the center point.
-
Azimuthal
Equidistant
-
Lambert Azimuthal Equal Area
-
The Lambert azimuthal equal-area projection is sometimes used
to map large
ocean areas. The central meridian is a straight line, others
are curved.
A straight line drawn through the center point is on a great
circle.
-
Lambert
Azimuthal Equal Area
-
Orthographic
-
Orthographic projections are used for perspective views of
hemispheres.
Area and shape are distorted. Distances are true along the
equator and
other parallels.
-
Oblique
Aspect Orthographic Projection
-
Stereographic
-
Stereographic projections are used for navigation in polar
regions. Directions
are true from the center point and scale increases away from
the center
point as does distortion in area and shape.
-
North
Polar Stereographic
Table
of Contents
Miscellaneous Projections
-
Unprojected Maps
-
Texas State-Wide Projection
-
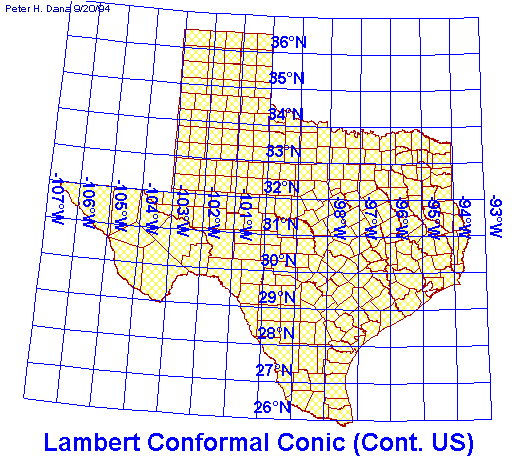
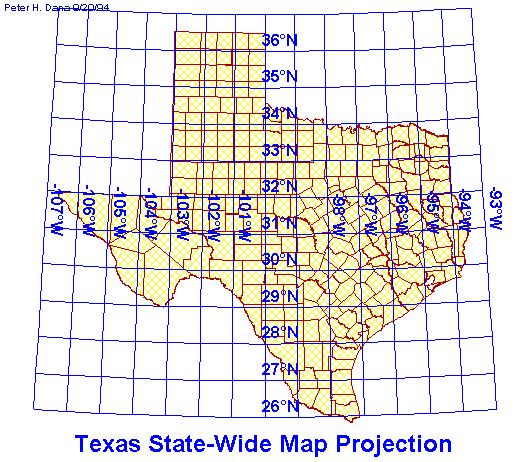
In 1992, the Cartographic Standards Working Group proposed a
Texas State-Wide
Map Projection Standard for the GIS Standards Committee of the
GIS Planning
Council for the Department of Information Sciences.
-
Earlier maps had often used projections designed for the
continental United
States
-
The new projection was designed to allow state-wide mapping
with a minimum
of scale distortion. A Lambert Conformal Conic Projection was
proposed
with an origin at 31:10 North, 100:00 West and with standard
parallels
at 27:25 North and 34:55 North. For plane coordinate use a
false Easting
and Northing of 1,000,000 meters were defined for the origin.
-
Space Oblique Mercator
-
The Space Oblique Mercator is a projection designed to show
the curved
ground-track of Landsat images. There is little distortion
along the ground-track
but only within the narrow band (about 15 degrees) of the
Landsat image.
-
Space
Oblique Mercator
Table
of Contents
References
-
Bugayevskiy, Lev M. and John P. Snyder. 1995. Map
Projections: A Reference
Manual. London: Taylor and Francis.
-
Muehrcke, Phillip C. and Juliana O. Muehrcke. 1998. Map Use:
Reading-Analysis-Interpretation,
4th ed. Madison, WI: JP Publications.
-
Snyder, John P. 1987. Map projections: a working manual. USGS
Professional
Paper 1395. Washington, DC: United States Government Printing
Office.
-
Many of the maps on this page were produced using MapInfo's MapInfo
and Golden Software's MapViewer and Surfer for
Windows.
Table
of Contents
Last revised 2014.9.11. References updated. KEF.
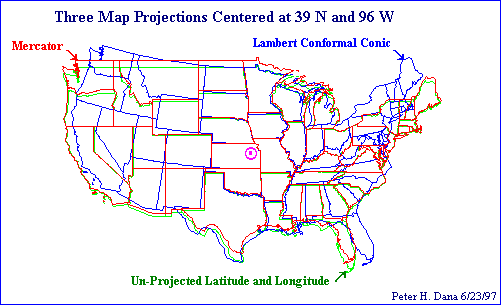 Three
Different Map Projections of the United States
Three
Different Map Projections of the United States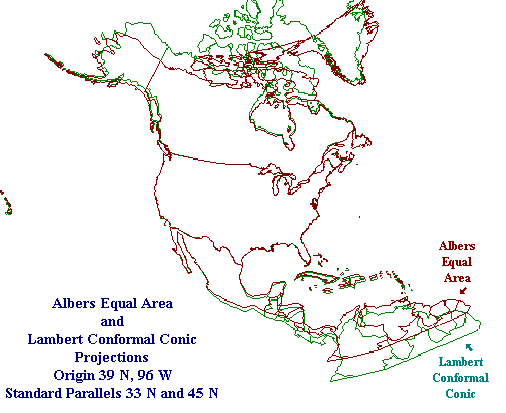 Albers
Equal Area and Lambert Conformal Conic Projections of North
America
Albers
Equal Area and Lambert Conformal Conic Projections of North
America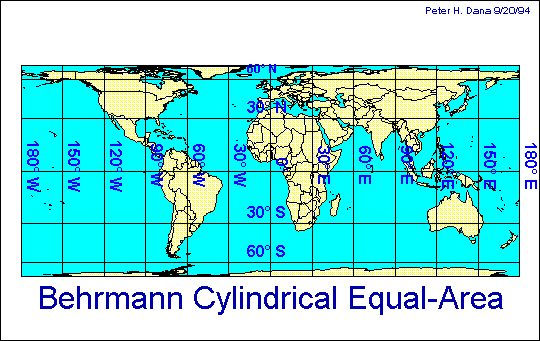 Behrmann
Cylindrical
Equal-Area
Behrmann
Cylindrical
Equal-Area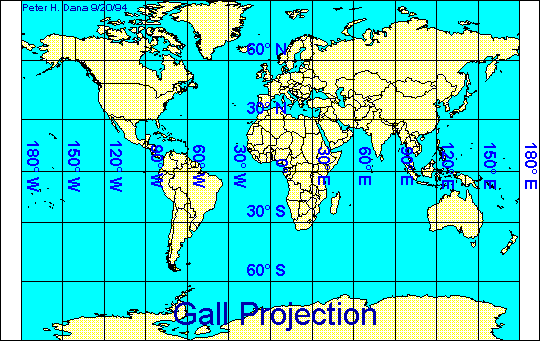 Gall's
Sterographic Cylindrical
Gall's
Sterographic Cylindrical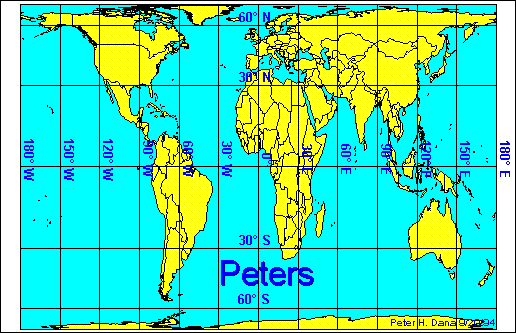 Peters
 Mercator
 Miller
Cylindrical
Miller
Cylindrical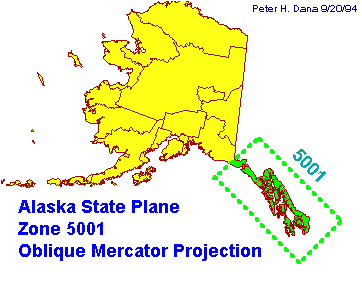 Oblique
Mercator (Alaska State Plane Zone 5001)
Oblique
Mercator (Alaska State Plane Zone 5001)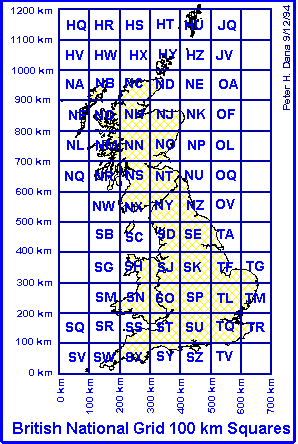 British
National
Grid 100 km Squares
British
National
Grid 100 km Squares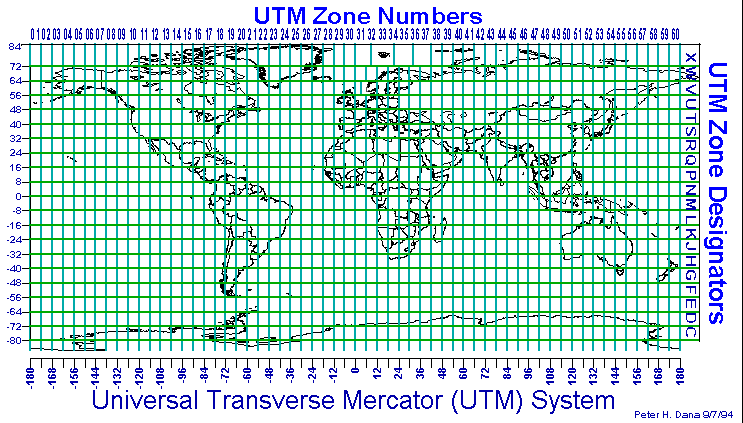 UTM
Zones
UTM
Zones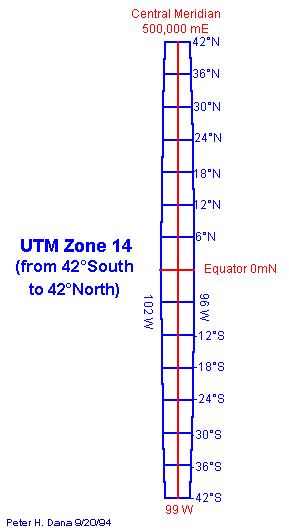 UTM
Zone 14
UTM
Zone 14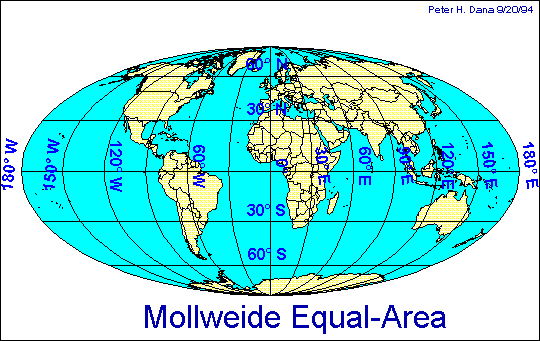 Mollweide
Projection
Mollweide
Projection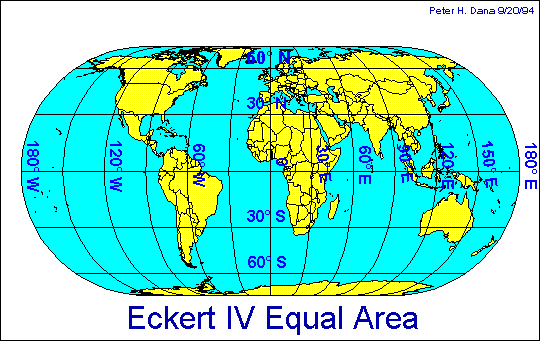 Eckert
IV
Equal Area
Eckert
IV
Equal Area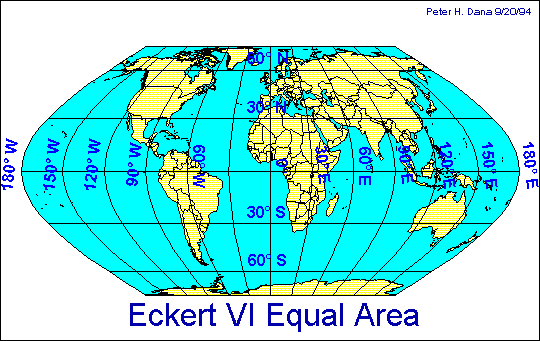 Eckert
VI
Equal Area
Eckert
VI
Equal Area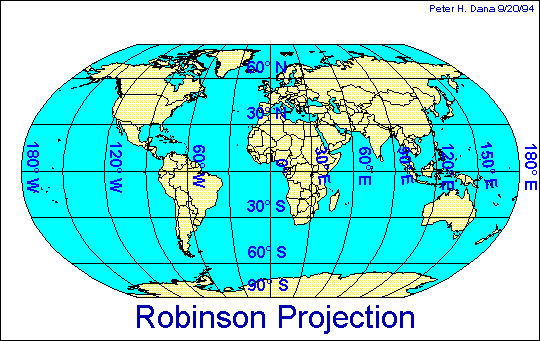 Robinson
 Sinusoidal
Equal Area
Sinusoidal
Equal Area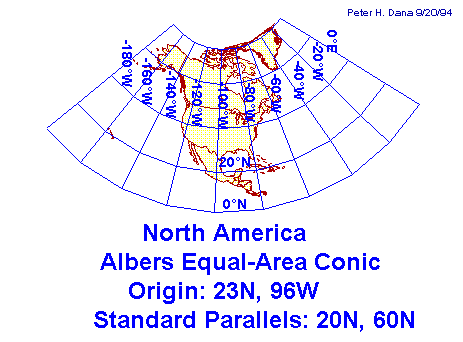 Albers
Equal-Area Conic
Albers
Equal-Area Conic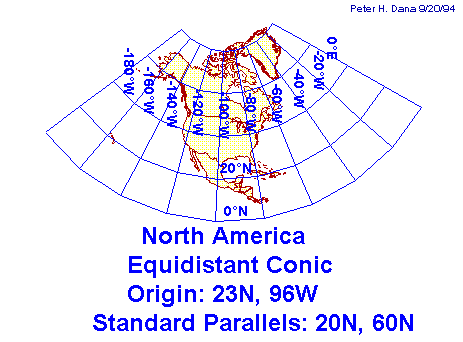 Equidistant
Conic
Equidistant
Conic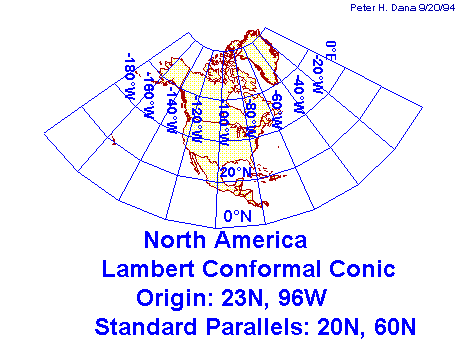 Lambert
Conformal Conic (North America)
Lambert
Conformal Conic (North America)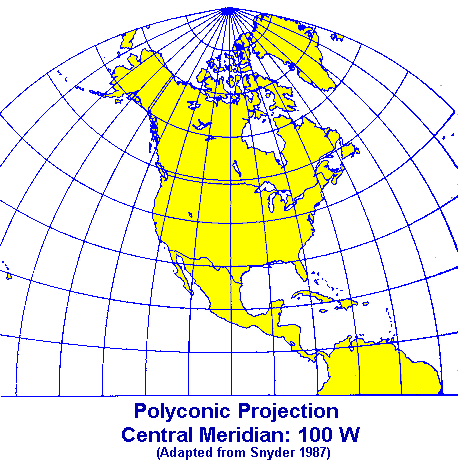 Polyconic
(North America)
Polyconic
(North America)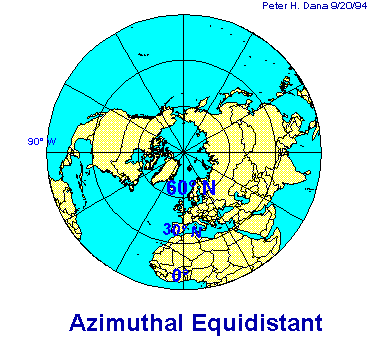 Azimuthal
Equidistant
Azimuthal
Equidistant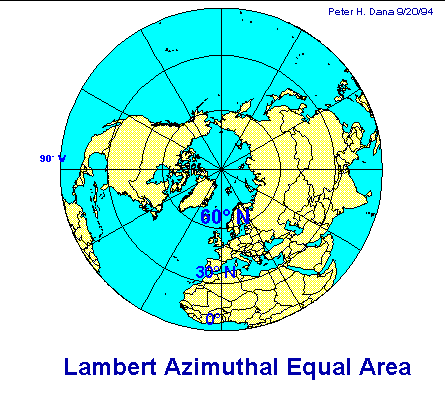 Lambert
Azimuthal Equal Area
Lambert
Azimuthal Equal Area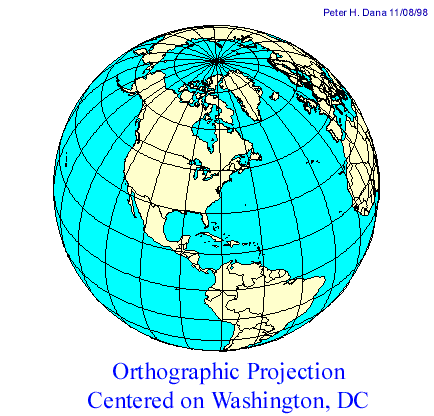 Oblique
Aspect Orthographic Projection
Oblique
Aspect Orthographic Projection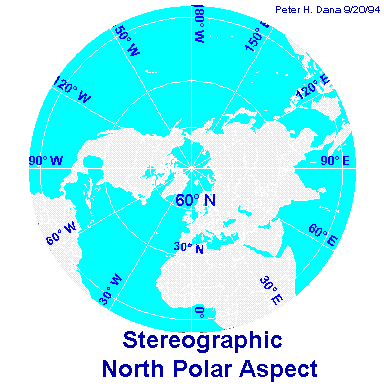 North
Polar Stereographic
North
Polar Stereographic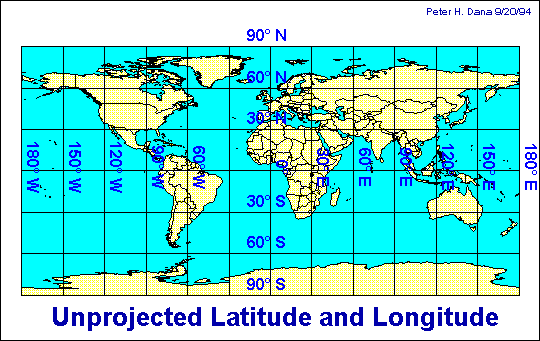 World:
Unprojected Latitude and Longitude
World:
Unprojected Latitude and Longitude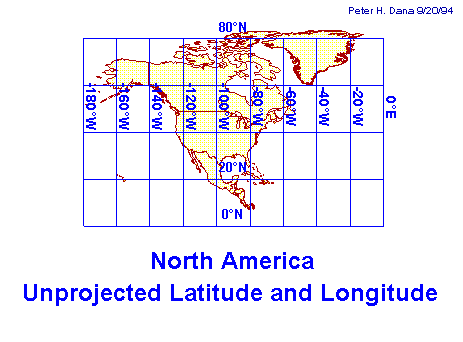 North
America: Unprojected Latitude and Longitude
North
America: Unprojected Latitude and Longitude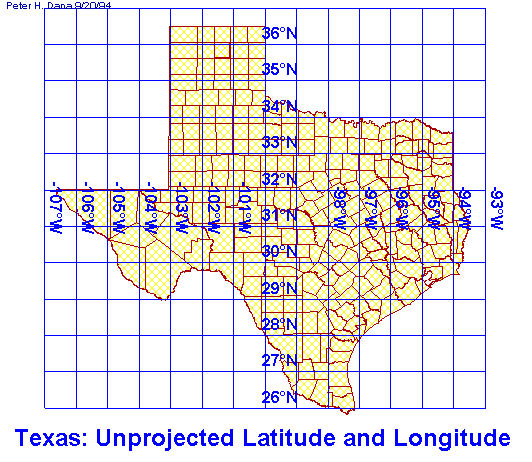 Texas:
Unprojected Latitude and Longitude
Texas:
Unprojected Latitude and Longitude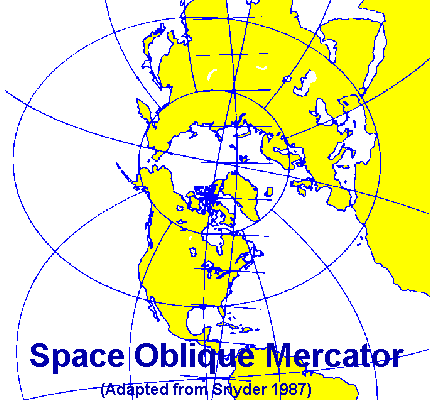 Space
Oblique Mercator
Space
Oblique Mercator